
FOREX MANAGED ACCOUNTS
This fund invests mainly in a diversified portfolio of ETF contracts (futures on oil, gas, gold and other commodities e.g. palladium, silver, copper, sugar, wheat etc.). These investments are currently subject to high volatility in principal value of an underlying asset. This risk is minimized by applying algo trading, arbitrage strategies commonly used by the hedge fund managers.. The Investment Fund series AAA will generally pay high interest on investments due adopt an arbitrage strategy along with well performed semi-automated platform of risks management and outstripping growth rates of the underlying asset, such as oil, gold, gas. Participants should have an investment time horizon of 1 - 3 years or more with min. investments 10`000 USD
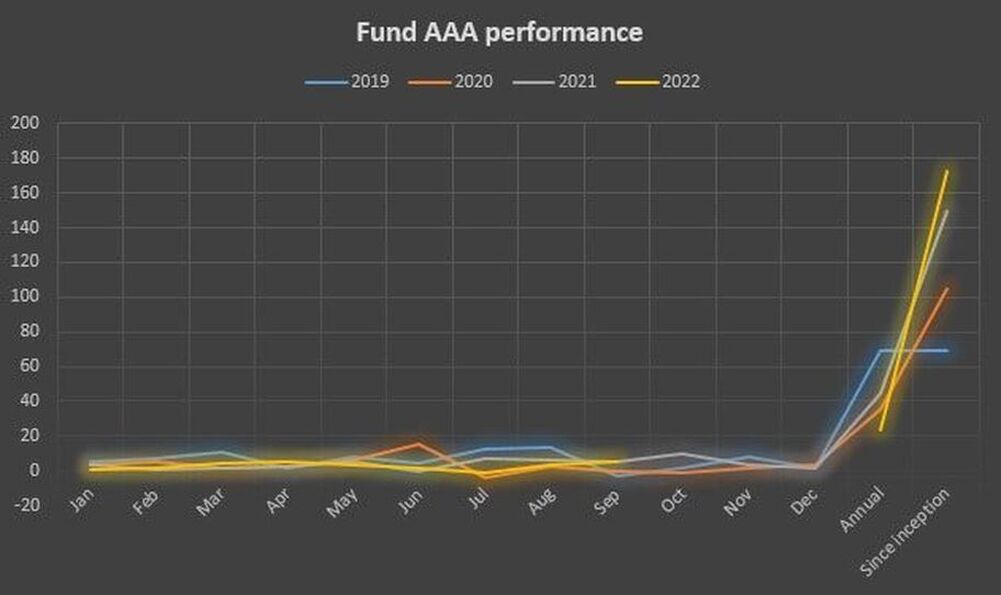
Jan |
Feb |
Mar |
Apr |
May |
Jun |
Jul |
Aug |
Sep |
Oct |
Nov |
Dec |
Annual |
Total |
|
2019 |
5.1 |
6.9 |
10.5 |
1.5 |
7.5 |
4.5 |
12.4 |
13.5 |
-3 |
1.5 |
7.5 |
1.2 |
69.1 |
69.1 |
2020 |
3.3 |
5.1 |
1.8 |
2.4 |
6.3 |
15.3 |
-3.9 |
2.1 |
-0.75 |
-1.5 |
1.5 |
3.75 |
35.4 |
104.5 |
2021 |
3.3 |
0.3 |
1.8 |
2.4 |
4.8 |
-0.75 |
7.2 |
6.3 |
4.8 |
9.6 |
3.75 |
1.35 |
44.85 |
149.35 |
2022 |
0.45 |
1.5 |
4.5 |
5.25 |
3.3 |
1.2 |
-1.3 |
3.6 |
4.8 |
23.3 |
172.65 |